In-Store People Counting and Sales Conversion Analysis: Converting Visitor Traffic into Sales
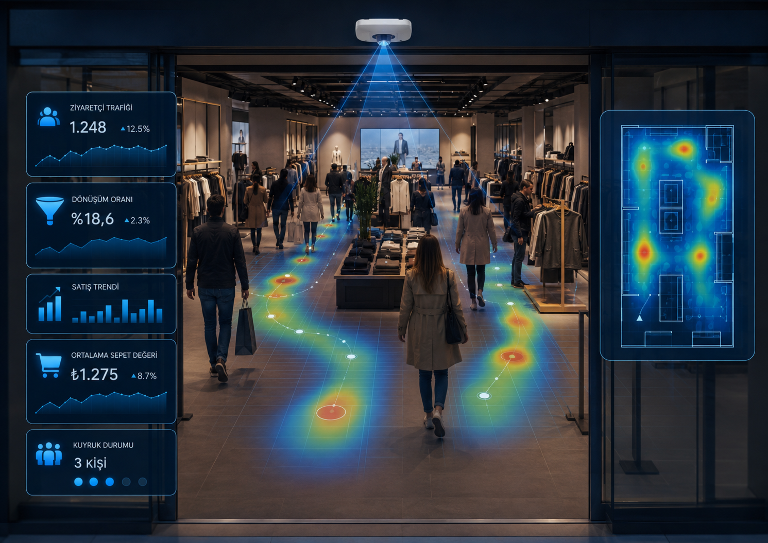
A store’s daily revenue alone does not explain why its performance is high or low. Combining people-counting data with POS, ERP, staffing and campaign data reveals how effectively the store converts its available visitor traffic into sales.
An increase in sales may result from higher visitor traffic, but it may also be caused by a greater proportion of existing visitors completing a purchase.
Similarly, declining sales do not always indicate poor performance by store staff or management. Visitor traffic within the shopping centre may have fallen, storefront visibility may have weakened, a campaign may have failed to attract sufficient interest, or there may not have been enough staff during peak hours.
For this reason, physical retailers should measure not only sales results but also the visitor traffic that occurs before a sale.
What Is a People-Counting System?
A people-counting system is a sensor, camera or AI-powered analytics infrastructure that measures visitors entering and leaving a store according to their direction of movement.
A properly configured system does more than display total visitor numbers. It can also report hourly, daily, weekly and monthly traffic changes, entrance and exit directions, peak periods and performance differences between stores.
System selection should not be based solely on the accuracy rate stated by the manufacturer. Site conditions such as entrance width, ceiling height, lighting, groups walking side by side, children, pushchairs, staff movements and multiple entrances must also be considered.
What Is the Sales Conversion Rate?
The sales conversion rate is a key retail performance indicator that shows the proportion of store visitors who complete a purchase.
For example, suppose 1,000 visitors enter a store in one day and 220 sales transactions are recorded in the POS system:
Approximately 22 out of every 100 visitors entering the store completed a purchase.
The definitions used to calculate conversion rates must be consistent across all stores. Standard company-wide rules should be established for returns, cancellations, staff purchases, group visits and online order collections.
High Revenue Does Not Always Mean High Performance
Consider two stores that generate the same revenue on the same day. The first store may have received 5,000 visitors, while the second received only 3,000. Although their sales figures appear identical, their ability to convert visitor opportunities into sales is not the same.
- Visitor traffic: Indicates the sales opportunity available to the store.
- Conversion rate: Shows how effectively visitors are converted into customers.
- Average transaction value: Shows how much customers spend per transaction.
Which Systems Can Be Integrated with People-Counting Data?
POS and ERP systems
Visitor numbers can be compared with transaction counts, total sales, units sold, returns and average transaction value. This enables conversion rates to be calculated by store, region and time period.
Staffing and shift-management systems
Staffing data can be compared with visitor density to determine whether sufficient employees are available during peak periods. Shifts can therefore be planned according to actual customer demand rather than historical sales alone.
Campaign and marketing data
Visitor traffic before, during and after a campaign can be compared to determine whether the campaign genuinely attracted additional visitors to the store.
Storefront traffic data
The number of people passing in front of the store can be compared with the number entering the store to calculate the store-entry or capture rate.
Heatmaps and zone analytics
Heatmaps show where visitors spend more time inside the store, which routes are used most frequently and which areas receive insufficient attention.
Essential Retail KPIs to Monitor
| KPI | Description | Application |
|---|---|---|
| Visitor count | Total number of visitors entering the store | Traffic and density analysis |
| Conversion rate | Transactions ÷ visitors | Sales performance |
| Revenue per visitor | Total revenue ÷ visitors | Store comparison |
| Average transaction value | Total revenue ÷ transactions | Sales quality |
| Store-entry rate | Visitors entering ÷ storefront traffic | Window display and visibility |
| Visitors per employee | Relationship between traffic and staffing capacity | Shift planning |
| Checkout waiting time | Average queue and service time | Customer experience |
Which Decisions Can These Analytics Support?
How Is a Successful People-Counting Project Implemented?
- Requirements and KPI analysis: The business questions that need to be answered are defined.
- Site survey: Entrances, ceiling height, lighting, power, network and camera infrastructure are reviewed.
- Pilot store: The solution is tested in a representative store.
- Installation and calibration: Manual verification tests are carried out.
- POS and ERP integration: Sales and traffic data are matched according to time.
- Dashboard design: Reports are created for management and store-level users.
- Action plan: Targets, thresholds, alerts and responsibilities are defined.
- Rollout: The solution is expanded to other stores after the pilot results have been validated.
People-Counting Systems and Data Protection
Systems that generate only anonymous entry and exit statistics should not be evaluated in the same way as systems that record video, analyse faces or attempt to identify individuals.
Where possible, projects can use solutions that process the minimum amount of data, perform anonymous counting directly on the device without storing images, and generate only statistical outputs.
Where video recording or personal-data processing is involved, transparency obligations, access permissions, data security and retention processes must be assessed separately.
The iTech Project Approach to Retail Analytics
At iTech Project, we do not treat people-counting systems as standalone sensor projects. We consider them part of a wider retail data architecture.
Our objective is to bring together data collected from store entrances, existing camera infrastructure, POS and ERP systems, checkout queues, heatmaps, shelf sensors and IoT devices within a unified analytics environment.
Frequently Asked Questions
Can a people-counting system work with existing store cameras?
Some video analytics solutions can work with existing IP cameras when the camera angle and image quality are suitable. Dedicated 3D sensors may be required at entrances where a higher level of accuracy is needed.
How is the sales conversion rate calculated?
The number of transactions is divided by the number of visitors entering the store, and the result is multiplied by 100.
Can staff movements affect visitor counts?
Staff movements may be included in visitor counts unless a filtering method is used. Depending on the solution, employee tags, separate staff entrances or analytics-based filtering may be applied.
Can the same conversion target be used for every store?
Store size, location, product category and customer profile vary, so stores should be evaluated within comparable format groups.
Do people-counting systems create data-protection concerns?
This depends on the technology used and the type of data processed. Systems that generate anonymous statistics should not be treated in the same way as systems that record video or attempt to identify individuals.
Let us evaluate your store’s existing infrastructure, data sources and operational objectives to plan a pilot people-counting and retail analytics project.
Let’s Evaluate Your Project Together →